A comprehensive business intelligence solution that transforms complex data into actionable insights through real-time visualization, predictive analytics, and customizable reporting dashboards.
Measurable results that transformed business operations
The Analytics Dashboard Platform was conceived to address a critical business challenge: our client's organization was drowning in data but starving for insights. Multiple departments were using disparate tools and manual processes to track performance, leading to inconsistent reporting and delayed decision-making.
My role as Product Manager involved leading a cross-functional team of 12 members including engineers, designers, and data scientists to create a unified analytics platform that would serve the entire organization.
The platform integrates data from multiple sources, provides real-time visualization, and enables predictive analytics capabilities that empower users at all levels to make data-driven decisions.
Interactive dashboards with live data updates and customizable widgets
Machine learning models for forecasting and trend analysis
Seamless data aggregation from CRM, ERP, and external APIs
Drag-and-drop interface for creating personalized reports
Granular permissions and data security based on user roles
How we overcame technical and business obstacles
The organization had data scattered across 15+ different systems, including legacy databases, cloud services, and third-party APIs. Each system had different data formats, update frequencies, and authentication methods.
Manual data consolidation was taking 40+ hours per week and often resulted in outdated or inconsistent information across departments.
I led the design and implementation of a robust ETL pipeline using Apache Kafka for real-time data streaming, with custom connectors for each data source. We implemented data validation and normalization processes to ensure consistency.
The solution reduced data processing time by 85% and eliminated manual data consolidation, providing real-time access to unified data across all departments.
Employees were accustomed to their existing tools and processes, even though they were inefficient. There was significant resistance to change, especially from senior staff who had been using Excel-based reporting for years.
Initial user testing revealed that 70% of users found the new interface "too complex" and preferred their old methods.
I implemented a phased rollout strategy, starting with power users and early adopters. We conducted extensive user research and redesigned the interface based on feedback, simplifying the initial user experience.
We developed a comprehensive training program and created role-specific dashboard templates. User adoption increased to 95% within 6 months, with 88% of users preferring the new platform.
The tools and technologies that powered our solution
Frontend Framework
Backend Runtime
Database
Cloud Infrastructure
Data Streaming
Data Visualization
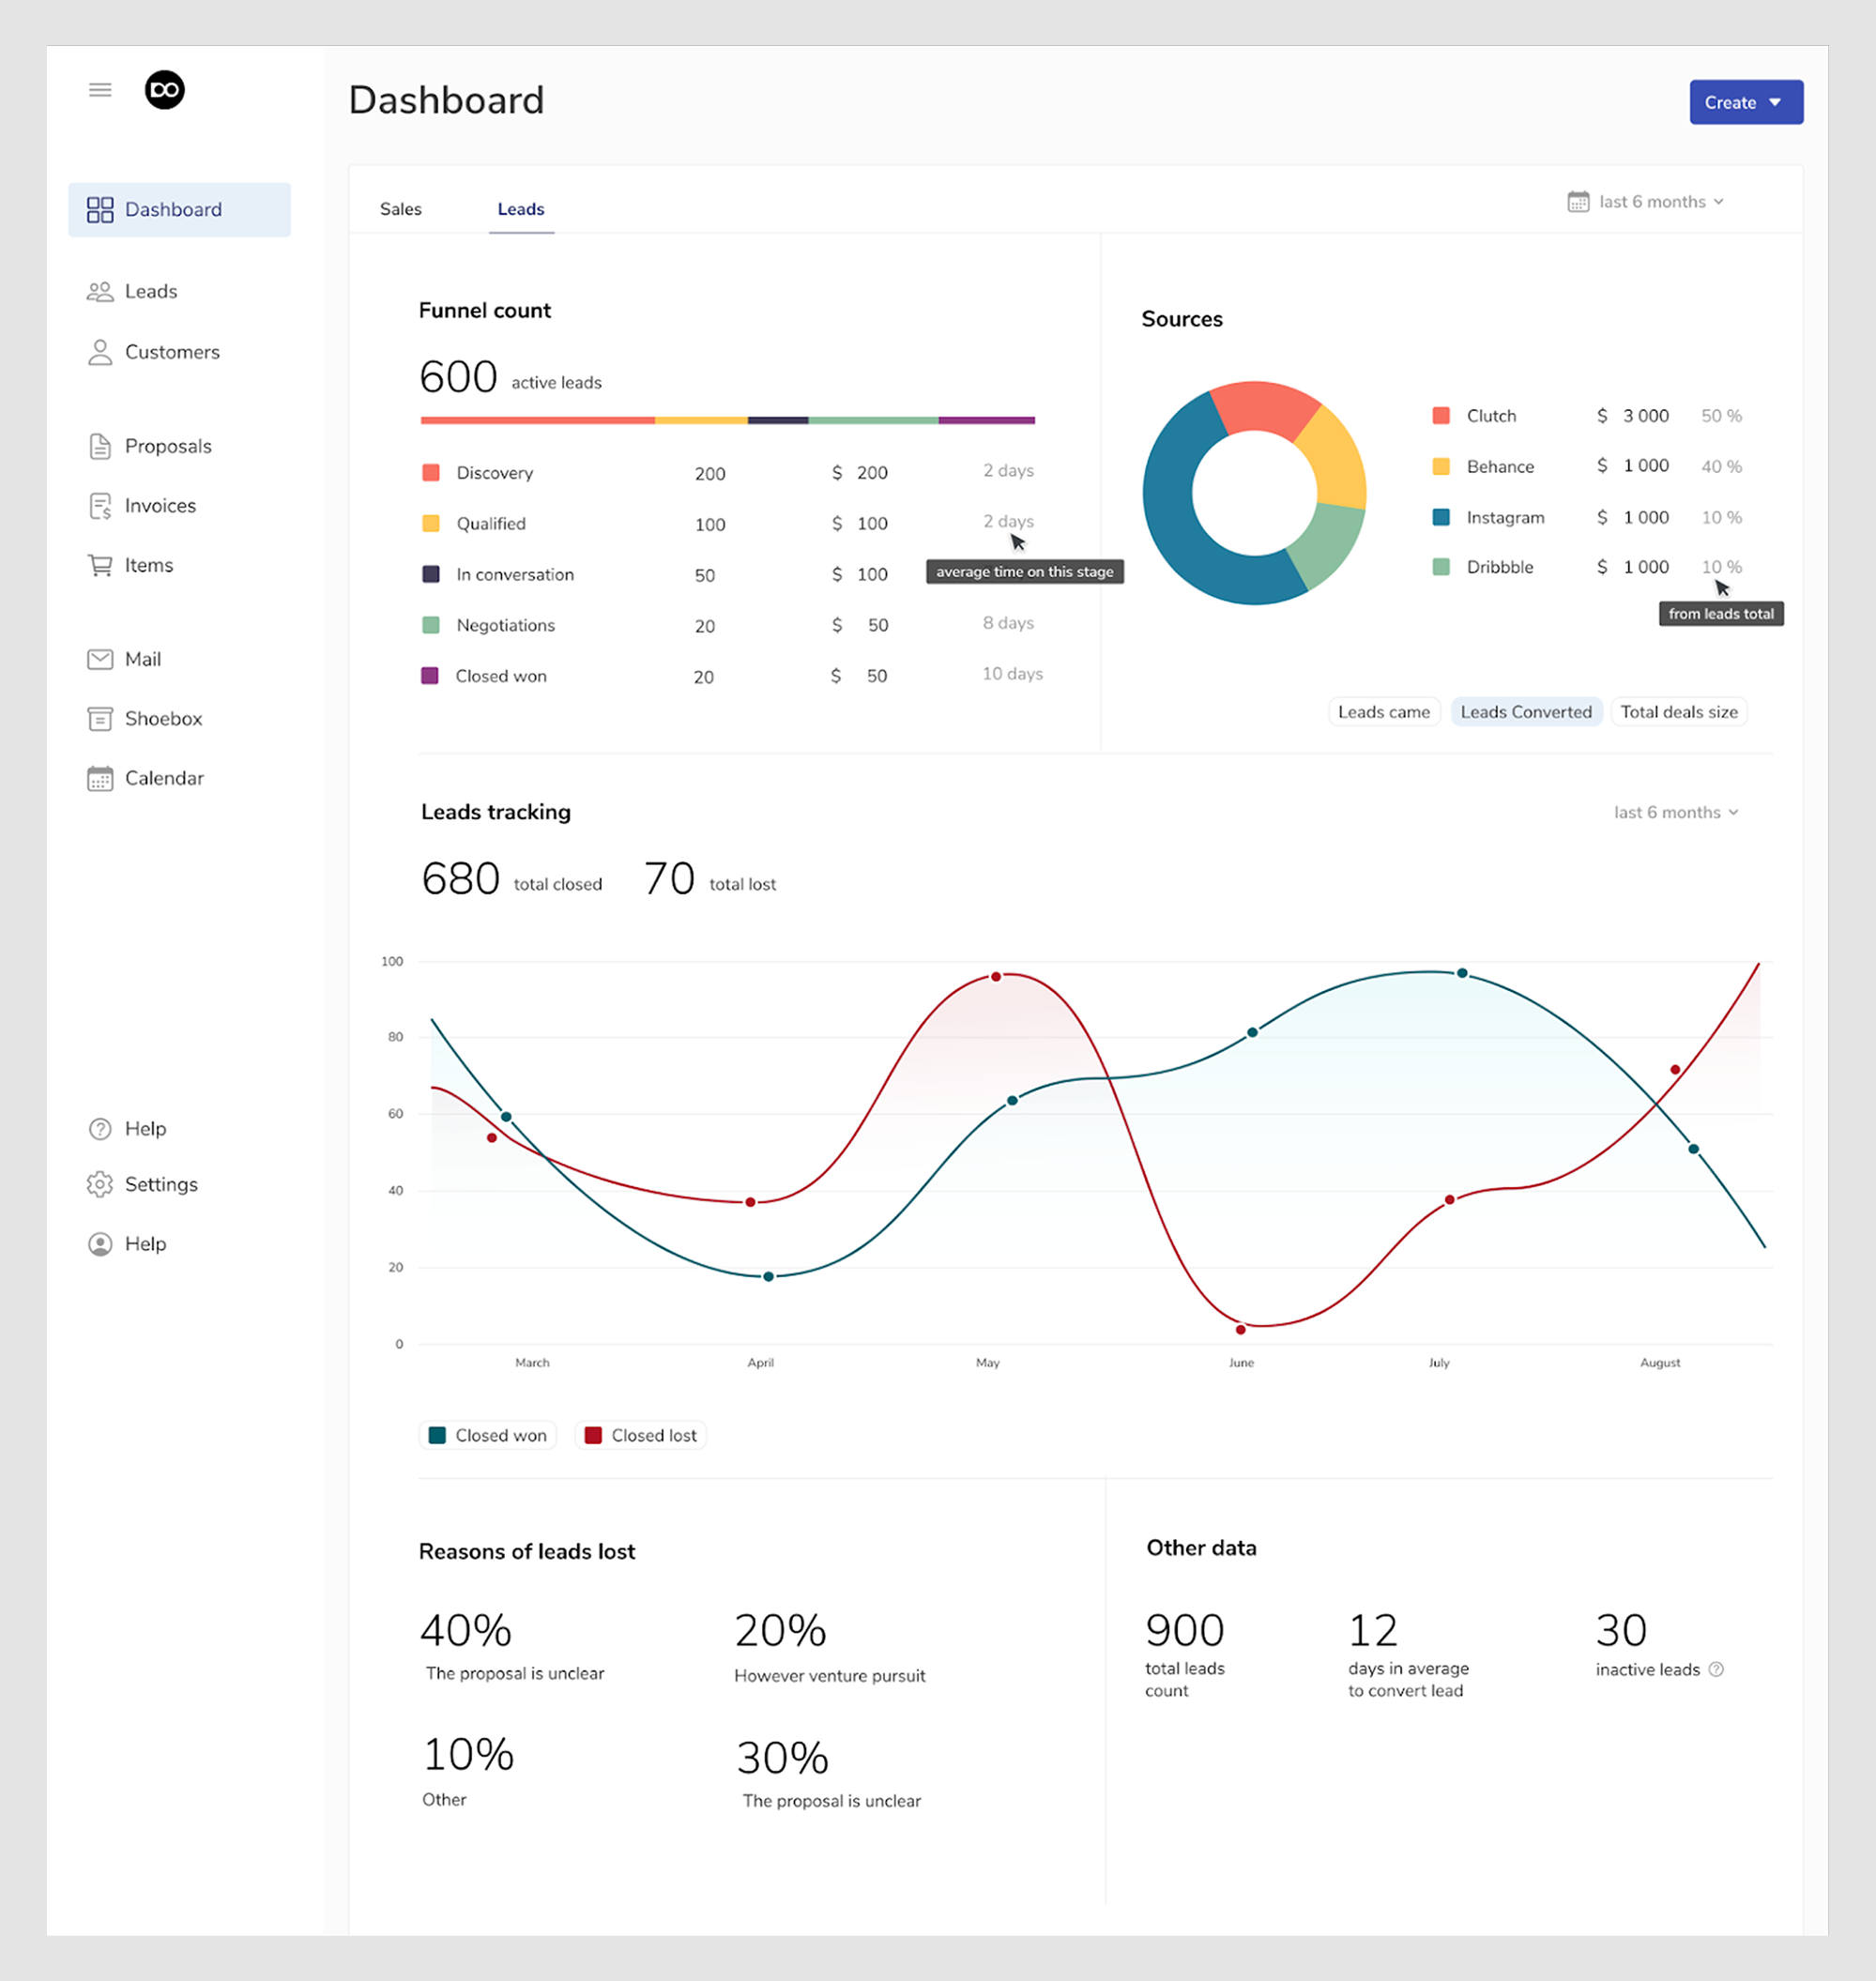
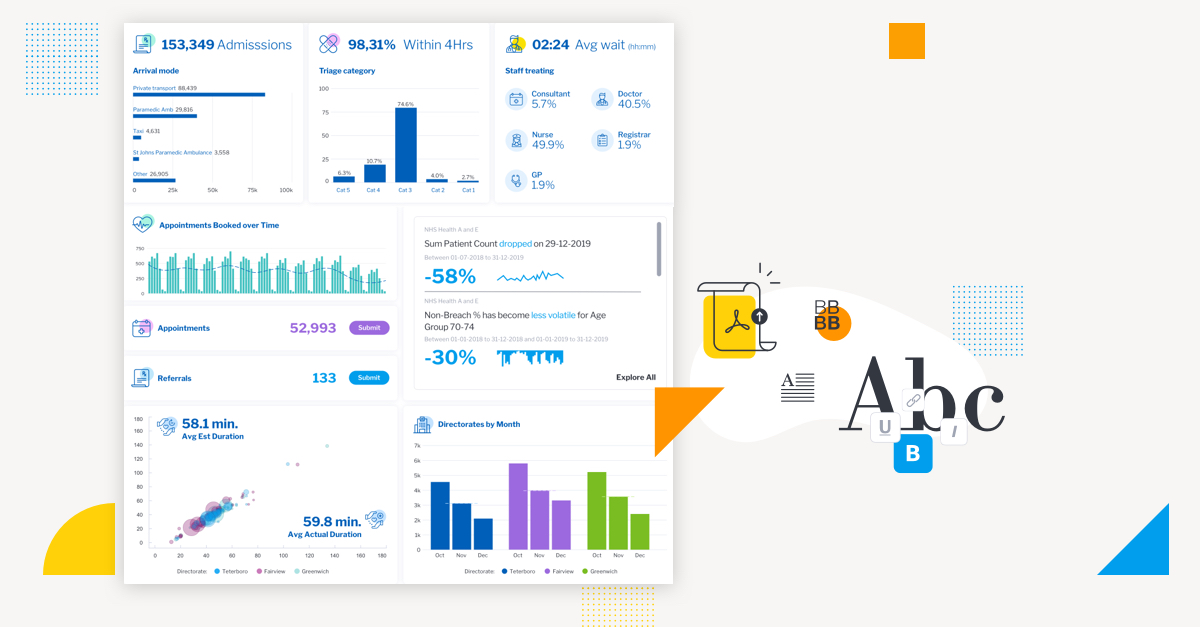
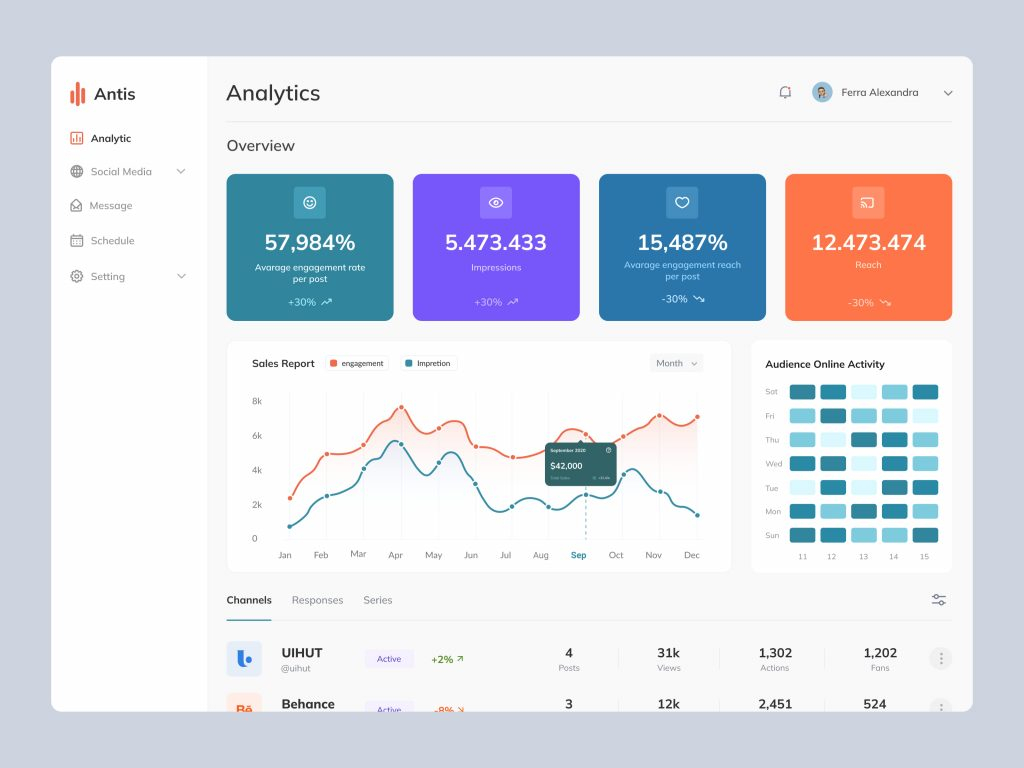
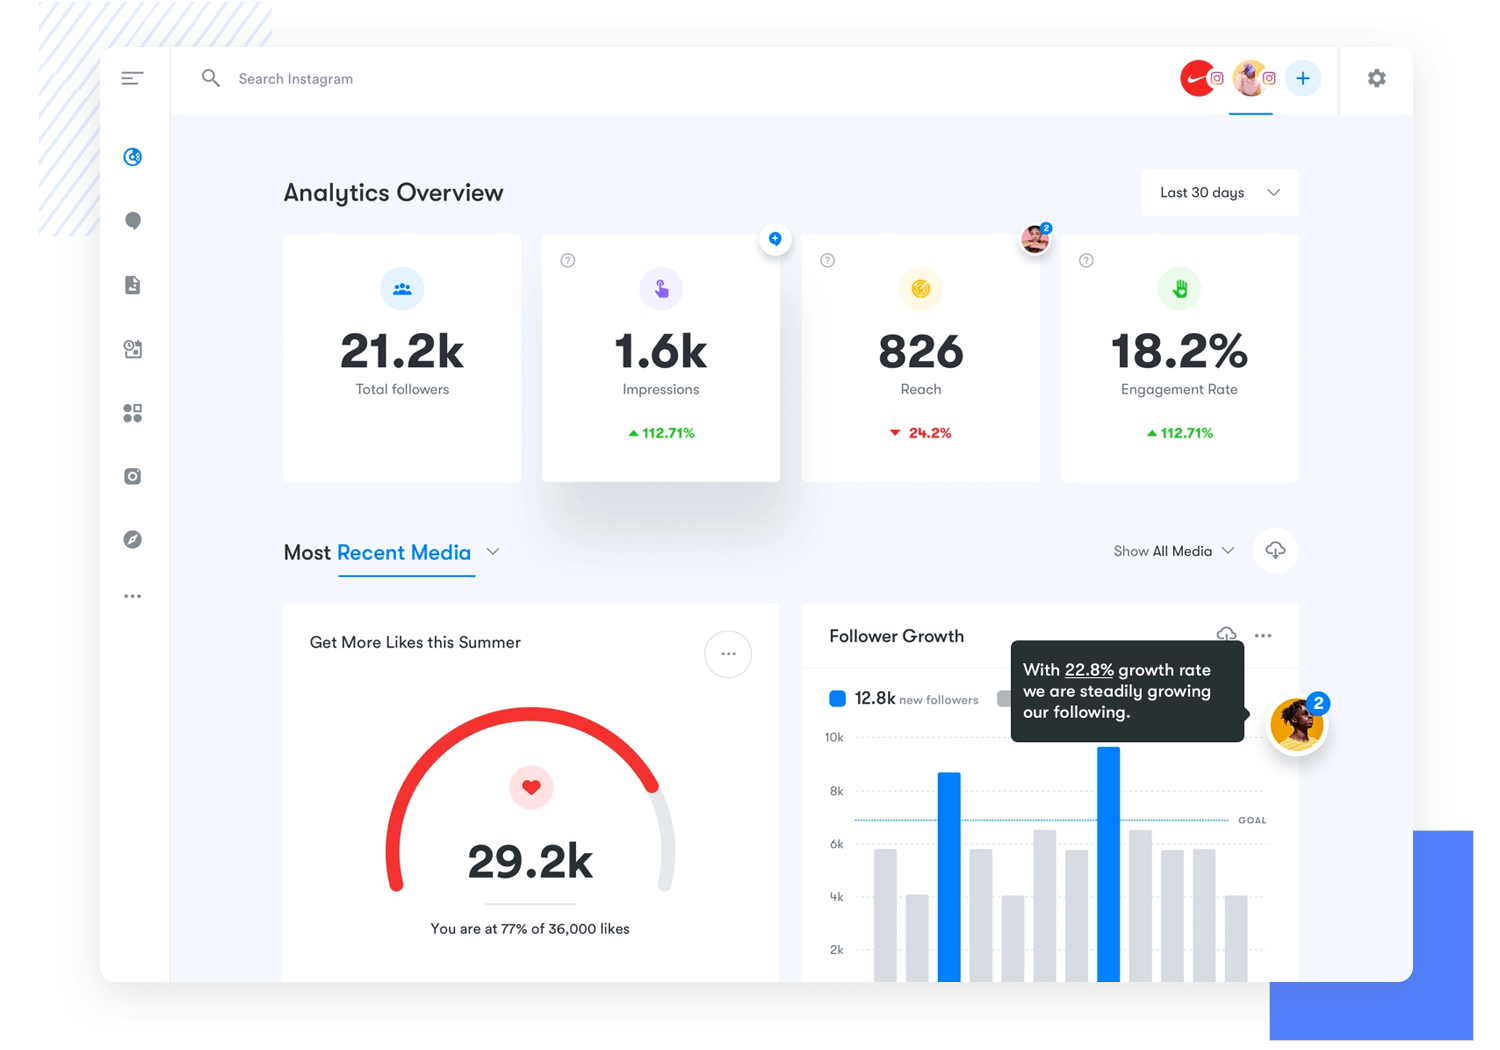
Visual showcase of the analytics platform interface
User-Centered Design: The importance of involving end-users throughout the development process cannot be overstated. Our initial designs failed because we didn't fully understand the user's workflow and mental models.
Iterative Development: Breaking down complex features into smaller, manageable releases allowed us to gather feedback early and adjust our approach based on real user behavior.
Data-Driven Decisions: Every feature decision was backed by user research and A/B testing, which significantly improved our success rate and user satisfaction.